New dynamic market reports
MLA is transitioning from PDF market reports to dynamic dashboards that offer greater insight into the market and allow users to view all saleyards from the one location. Users have the opportunity to use these new dashboards to interpret market dynamics and gain access to deeper insights to enhance business decision-making.
Data previously available via PDF reports is still available via the new reports, and can be viewed on a phone, tablet or PC.
Click here for ‘how to use video’
Click here for cattle market dashboard
Click here for sheep market dashboard
Key features of the new dashboards include:
- audio recordings
- written commentary
- state, saleyard and report date selector
- pie chart breakdowns
- table - week-on-week change
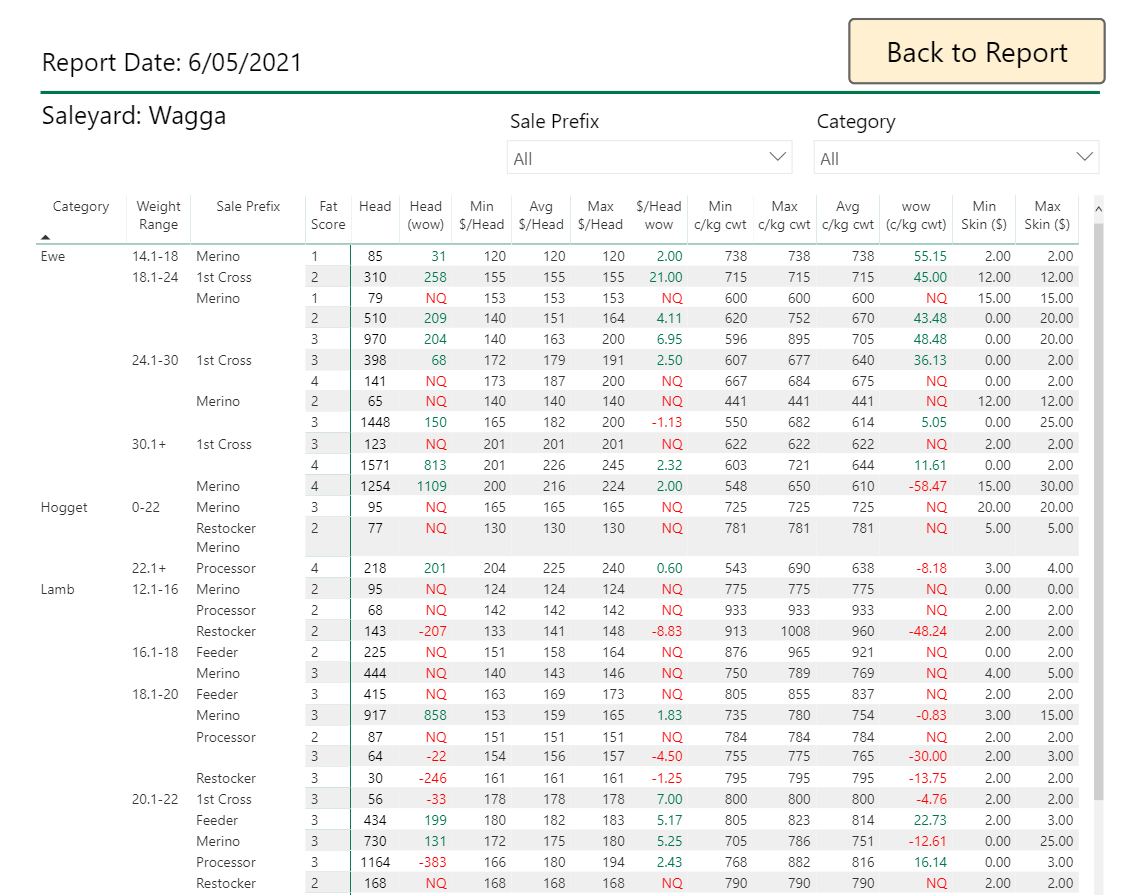
- full breakdown of saleyard data with dynamic selection (PC only)
- sort data (high and low).
How to use the new dashboards
Basic functionality
1. Upon entering a dashboard and prior to selecting any filters, users will see a breakdown of the entire sale.
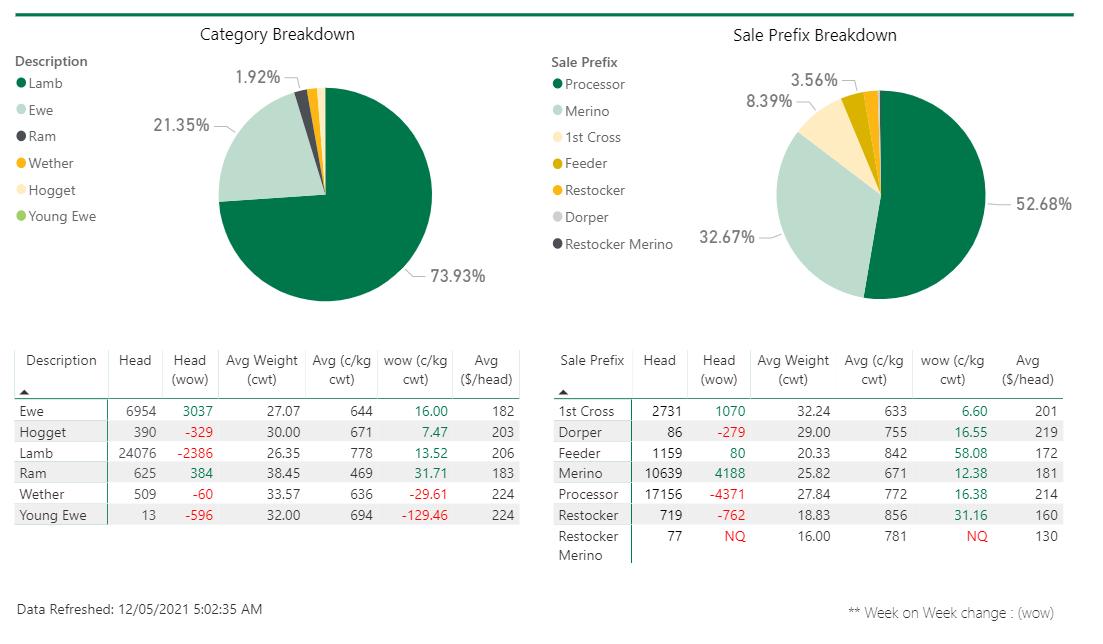
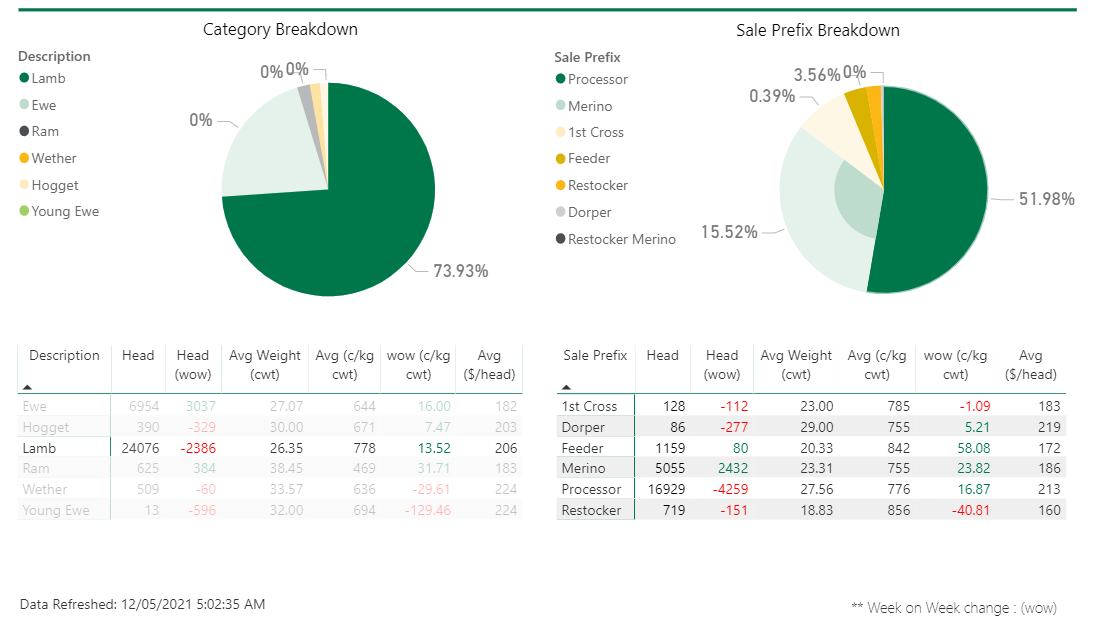
2. Clicking ‘Lamb’ provides sale data and breakdown for lamb only. Other selections will provide respective breakdowns.
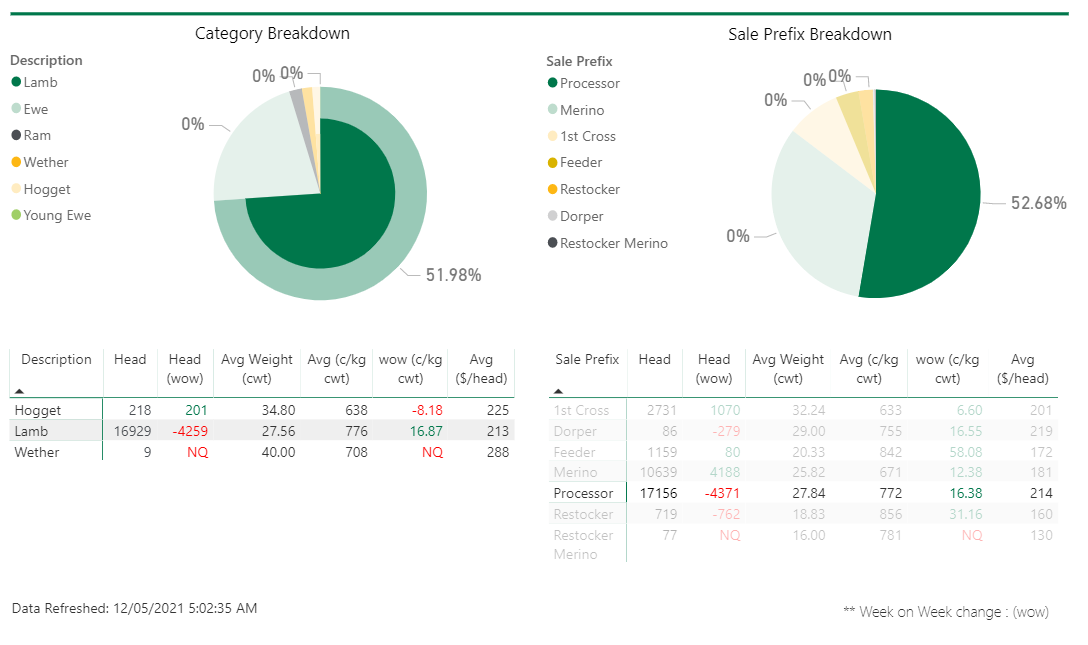
3. Clicking ‘Processor’ provides sale data and breakdown for processors only. Other selections will provide respective breakdowns.
4. To access the comprehensive data set on desktop/PC, click the ’Click here for data’ button. Note – comprehensive data is not currently available on mobile.
5. The ‘Clear filters’ button allows you to reset the dashboard to re-choose criteria.

Updated report dashboards include:
Eastern Young Cattle Indicator
Western Young Cattle Indicator
Eastern states daily indicators
© Meat & Livestock Australia Limited, 2021


