Know the facts: Q1 2018 cattle and sheep markets
Cattle
How did Australia’s cattle market fare in the first quarter of 2018?
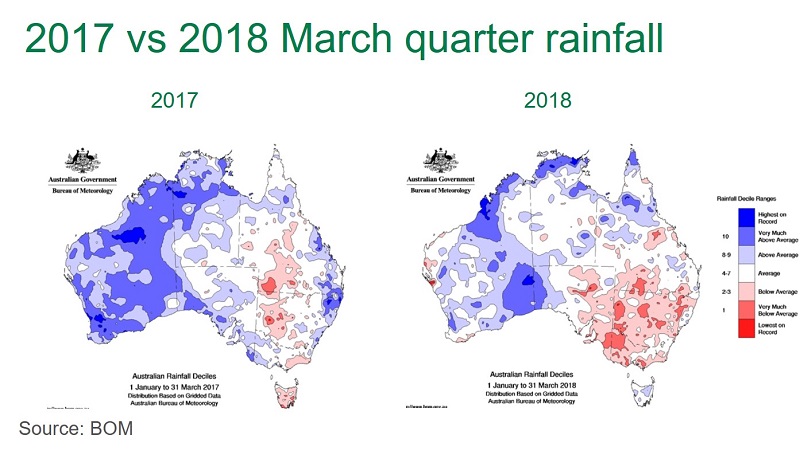
The south-east corner of the country has had, for the most part, a very dry first quarter. Almost all of NSW, Victoria, eastern SA and parts of southern and central Queensland have experienced below average rainfall for the January–March period. Pasture conditions have deteriorated in these areas, with many producers relying on supplementary feed, and quality of stock is reportedly starting to show the effects of the dry summer.
Supply
National cattle yardings for the first quarter at MLA reported saleyards were 19% higher year-on-year, at close to 682,000 head. NSW and Queensland drove the overall increase, with numbers up 31% and 33%, respectively. Throughput in Victoria and WA declined 4% year-on-year in both states, while SA and Tasmania were 18% and 47% lower, respectively.
The number of adult cattle processed in the eastern states for the January–March period, as reported by MLA, was 4% higher than the same time last year, but down 9% from 2016 levels. In NSW, the adult cattle kill for the March quarter was up 7% on year-ago levels, while slaughter throughput in Queensland lifted 2%. The number processed in Victoria increased 20% year-on-year, while SA levels were down 32%.
Prices
The Eastern Young Cattle Indicator (EYCI) averaged 544¢/kg carcase weight (cwt) in the March quarter – down 14% year-on-year, although well-above (19%) the five-year average for the period.
In NSW, the restocker steer (200–280kg) saleyard indicator was 16% lower year-on-year, at 301¢/kg live weight (lwt), trade steers (330–400kg) were down 13%, at 300¢/kg lwt, while heavy steers (500–600kg) were 12% lower, at 263¢/kg lwt.
Restocker steers through Queensland saleyards in the March quarter averaged 10% lower year-on-year, at 334¢/kg lwt. The trade steer indicator fell 8%, to 292¢/kg lwt, while heavy steers eased 1%, averaging 269¢/kg lwt.
In Victoria, the restocker steer saleyard indicator was 26% below 2017 levels, at 254¢/kg lwt, while trade steers were back 16%, at 279¢/kg lwt. Heavy steers were down 15% year-on-year, to average 260¢/kg lwt.
In SA and WA, trade steers through saleyards averaged 261¢/kg lwt and 274¢/kg lwt, down 20% and 11% year-on-year, respectively.
Sheep
The very dry season across many of the key sheep supply regions of the south-east has seen larger numbers of stock than anticipated turned off so far in 2018.
Almost all of NSW, Victoria, eastern SA and parts of southern and central Queensland have experienced below average rainfall for the January–March period. Many producers are now relying on supplementary feeding, as pasture conditions worsen.
Supply
Sheep have been the biggest mover in the first quarter, with eastern states slaughter up 7% year-on-year – driven primarily by NSW. National sheep saleyard throughput was 7% higher than the corresponding period last year, at just over 267,000 head.
Eastern states lamb slaughter for the March quarter increased 2% year-on-year, underpinned by larger numbers processed in Victoria and NSW. National saleyard throughput, however, was 2% lower than year-ago levels, at just over 568,000 head.
Prices
The Eastern States Trade Lamb Indicator (ESTLI) has held up well, despite the steady supplies and dry weather, averaging 623¢/kg carcase weight (cwt) in the March quarter – just 1¢ lower than last year. Compared to the five-year average for the first quarter however, 2018 is tracking around 22% higher. Eastern states restocker lambs through saleyards averaged 644¢/kg cwt for the first quarter, down 6% year-on-year, while heavy lambs were unchanged, on 624¢/kg cwt. The eastern states mutton indicator averaged 415¢, just 1% below 2017 levels.
In WA, restocker lambs were 3% lower year-on-year, averaging 553¢/kg cwt in the March quarter, while trade and heavy lamb saleyard indicators lifted 8% and 7%, respectively, to 635¢/kg cwt and 617¢/kg cwt. The WA mutton indicator also followed a dearer trend, up 4% year-on-year, to average 414¢/kg cwt.